We may earn a commission if you buy through links on this page. It never changes a score or a ranking. How we make money
The best observability platform depends on what your team wants to operate: a hosted service, an open-source stack, or a focused tool for application performance. Grafana and Prometheus are strong starting points for teams that want open-source components; Honeycomb is aimed at distributed-system investigation; and New Relic and Datadog offer broader hosted platforms. Entry prices do not show what a production deployment will cost. Before choosing, check how charges scale with telemetry, which SDKs and integrations your codebase needs, and whether you can export data or self-host.
Quick picksThe shortlist
 GrafanaGrafanaBest overall · $19/mo
 PrometheusPrometheusBest open source · Free
 HoneycombHoneycombBest for tracing · $150/mo
 New RelicNew RelicBest hosted platform · $10/mo
 DatadogDatadogBest for broad stacks · $500/mo
 Scout APMScout APMBest for application debugging · $19/mo
 ZabbixZabbixBest self-hosted infrastructure · Free
 CheckmkCheckmkBest hybrid infrastructure · Free
 GraylogGraylogBest for self-hosted logs · $1,250/mo
 CoralogixCoralogixBest for cloud-stored telemetry · Custom
01Compared at a glance
| Tool | Score | From | Free plan | Trial |
|---|---|---|---|---|
| GrafanaGrafana | 7.6 | $19/mo | Yes | — |
| PrometheusPrometheus | 7.8 | Free | Yes | — |
| HoneycombHoneycomb | 7.7 | $150/mo | Yes | — |
| New RelicNew Relic | 7.2 | $10/mo | Yes | — |
| DatadogDatadog | 6.2 | $500/mo | No | — |
| Scout APMScout APM | 7.0 | $19/mo | Yes | 14 days |
| ZabbixZabbix | 7.8 | Free | Yes | — |
| CheckmkCheckmk | 7.2 | Free | Yes | — |
| GraylogGraylog | 7.4 | $1,250/mo | Yes | — |
| CoralogixCoralogix | 7.0 | Custom | No | 14 days |
02The picks, in detail
- Best overallGrafanaGrafana
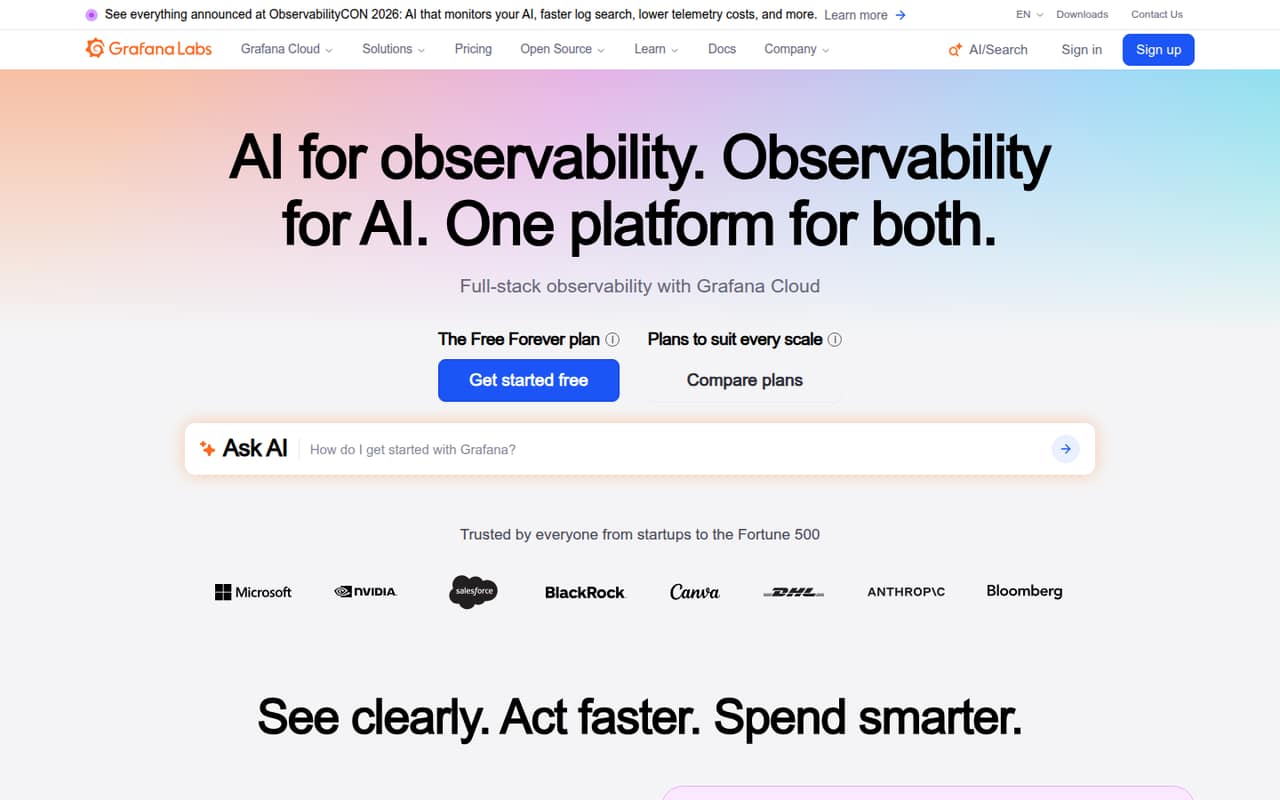
Grafana is our broadest fit for teams combining telemetry sources and building dashboards. It is listed as open source, has a free plan, and starts at $19. That mix gives teams room to evaluate both self-managed and paid use. Check how the specific Grafana products you plan to deploy are licensed and priced, and model telemetry costs before expanding collection.
What works
- Unifies logs, metrics, traces and profiles
- Free plan includes 10k active metric series monthly
- Built around OpenTelemetry and Prometheus
What doesn't
- Pro adds usage charges beyond a $19 monthly platform fee
- Included Pro usage varies by product
- Dashboard setup and upkeep can take time
- Best open sourcePrometheusPrometheus
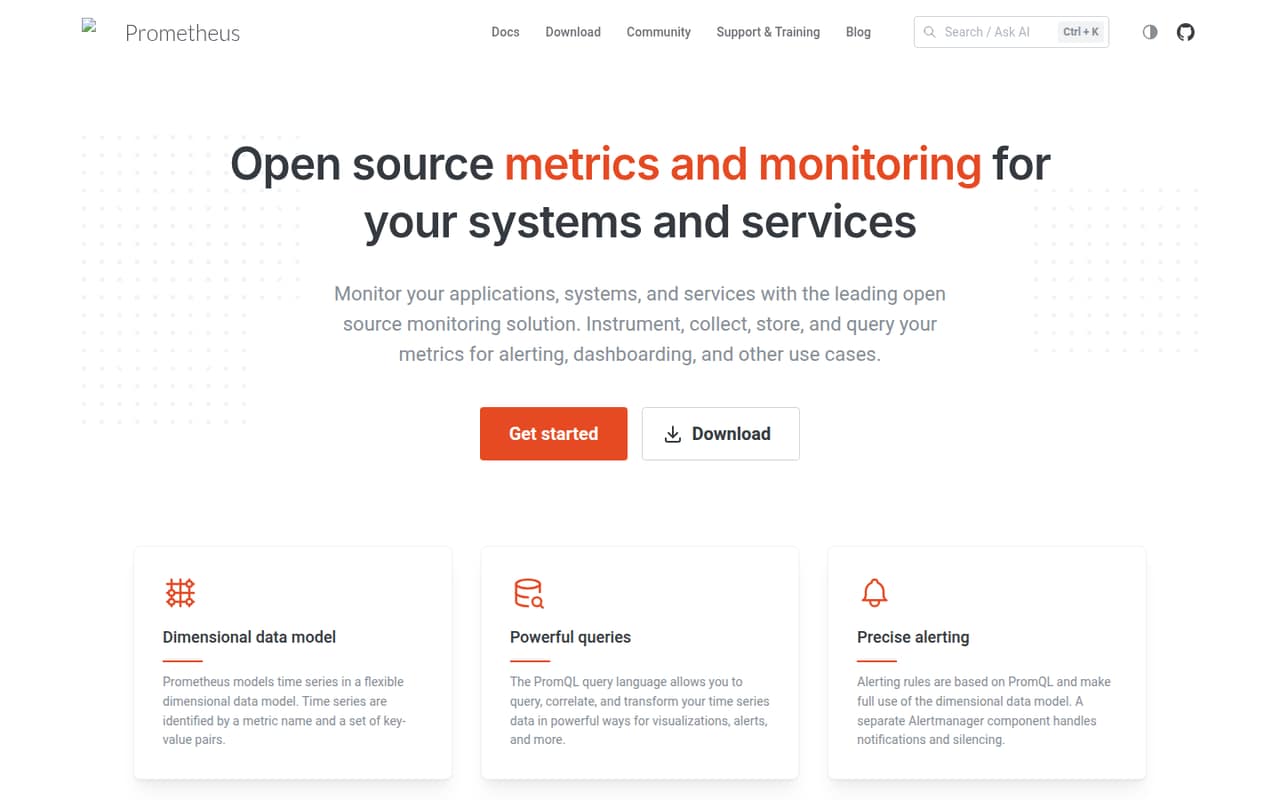
Prometheus is an open-source, self-hostable metrics platform with PromQL and no usage fees in the listed free plan. It fits teams that want control over metric storage and are prepared to run the servers. The trade-off is operational responsibility: plan for deployment, storage, upgrades and alerting rather than treating the $0 starting price as a production cost estimate.
What works
- Free, open source and Apache 2.0 licensed
- Dimensional time-series model with key-value labels
- PromQL queries and alerting rules
What doesn't
- Servers depend on local storage
- Teams operate and scale the servers themselves
- Homepage does not name an API protocol
- Best for tracingHoneycombHoneycomb
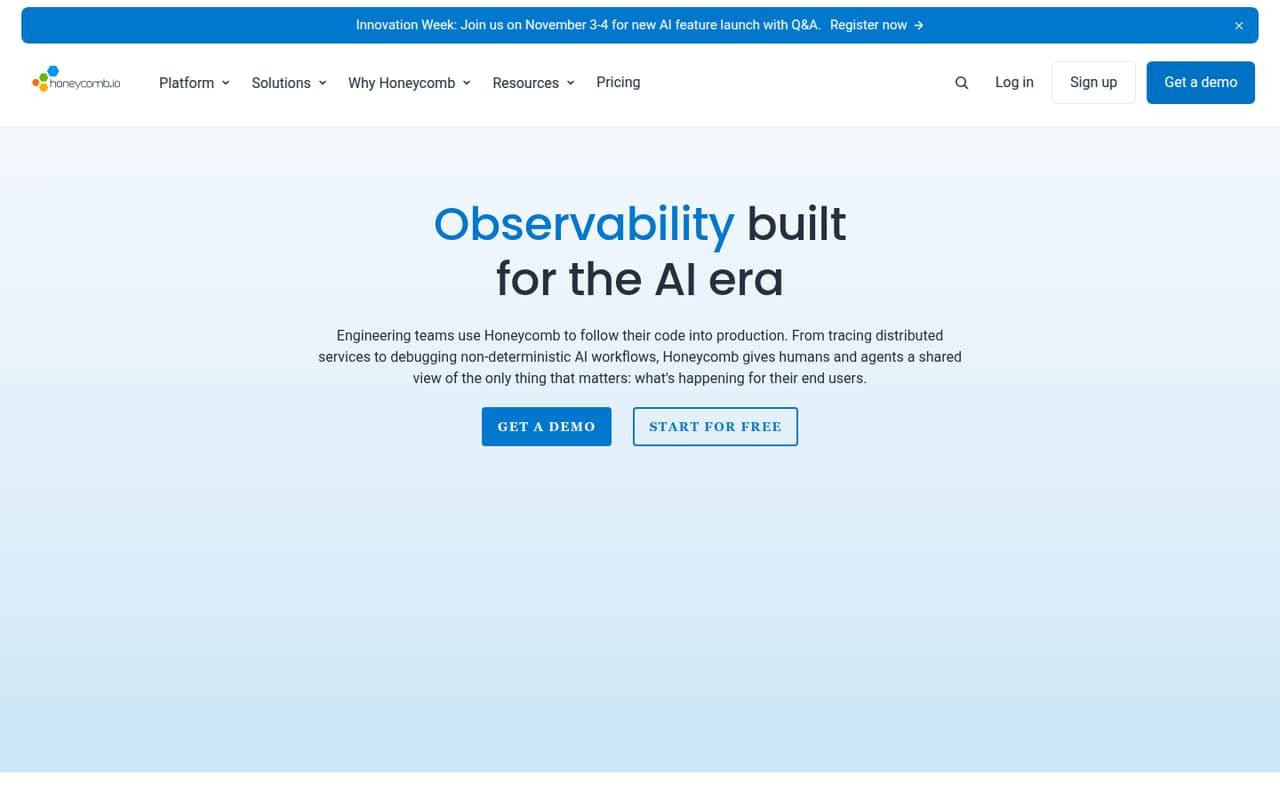
Honeycomb is a fit for teams investigating distributed production systems and high-cardinality telemetry. Its listed capabilities include OpenTelemetry and MCP hooks, which give developers integration paths to evaluate against their stack. The pricing page lists a free plan and a $150 starting price; check usage limits and the billing model against expected event volume before routing production telemetry.
What works
- Free tier includes tracing and BubbleUp
- OpenTelemetry-native approach supports portable instrumentation
- High-cardinality event data and real-time queries
What doesn't
- Pro pricing starts at $150 per 50M events
- Enterprise pricing is custom
- Annual Pro pricing is not published
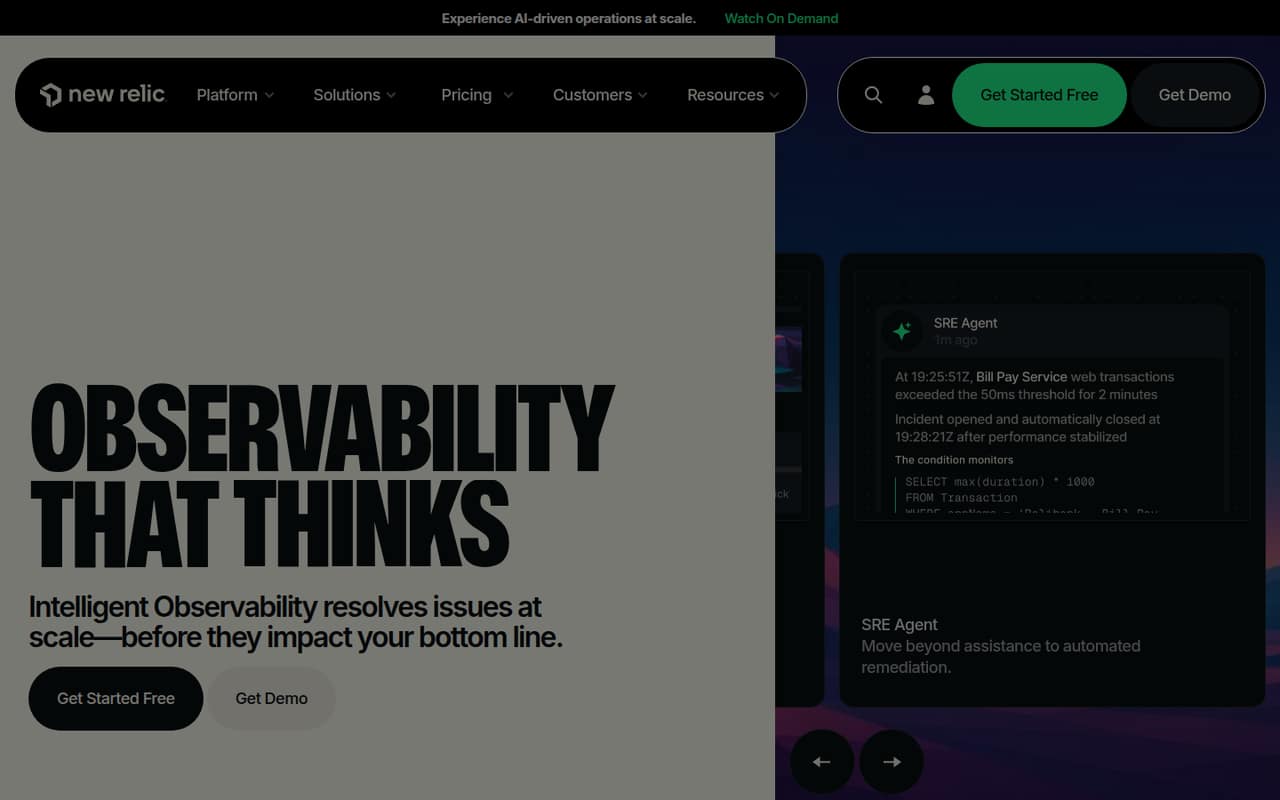
- Best hosted platformNew RelicNew Relic
New Relic suits teams looking to consolidate observability tools and coordinate application and infrastructure incident response in a hosted platform. It lists a free plan and a $10 starting price, with the free ingest allowance identified as a factor to watch. Model both ingest and user costs at expected team size and telemetry volume before moving services onto it.
What works
- APM, logs, infrastructure and security in one platform
- Free plan includes 100 GB monthly data ingest
- OpenTelemetry is highlighted as a standard
What doesn't
- Standard adds $99 monthly for each additional full-platform user
- Ingest beyond 100 GB is billed per GB
- Pro's lower price requires an annual commitment
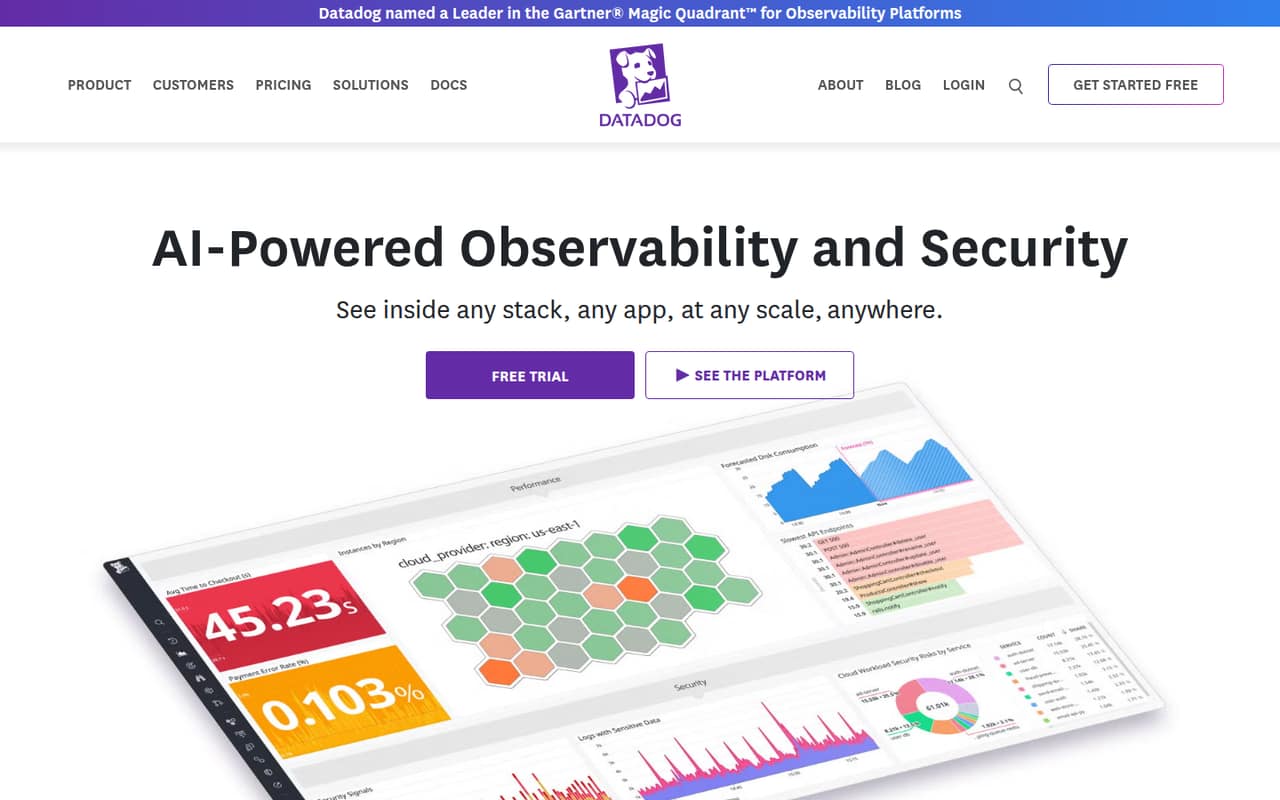
- Best for broad stacksDatadogDatadog
Datadog combines observability and security, with a stated fit for Kubernetes and cloud infrastructure operators. That breadth may suit teams trying to consolidate tools, but the listed starting price is $500 and usage costs require telemetry management. Confirm the products, integrations and billing units your deployment needs; avoid collecting signals by default without a retention and cost plan.
What works
- Covers infrastructure, applications, data, logs, and user experience
- Includes security and software delivery products
- Provides an API, OpenTelemetry, and integrations
What doesn't
- No free plan is listed
- Platform-wide starting price is not published
- AI Credits monthly billing price is not listed
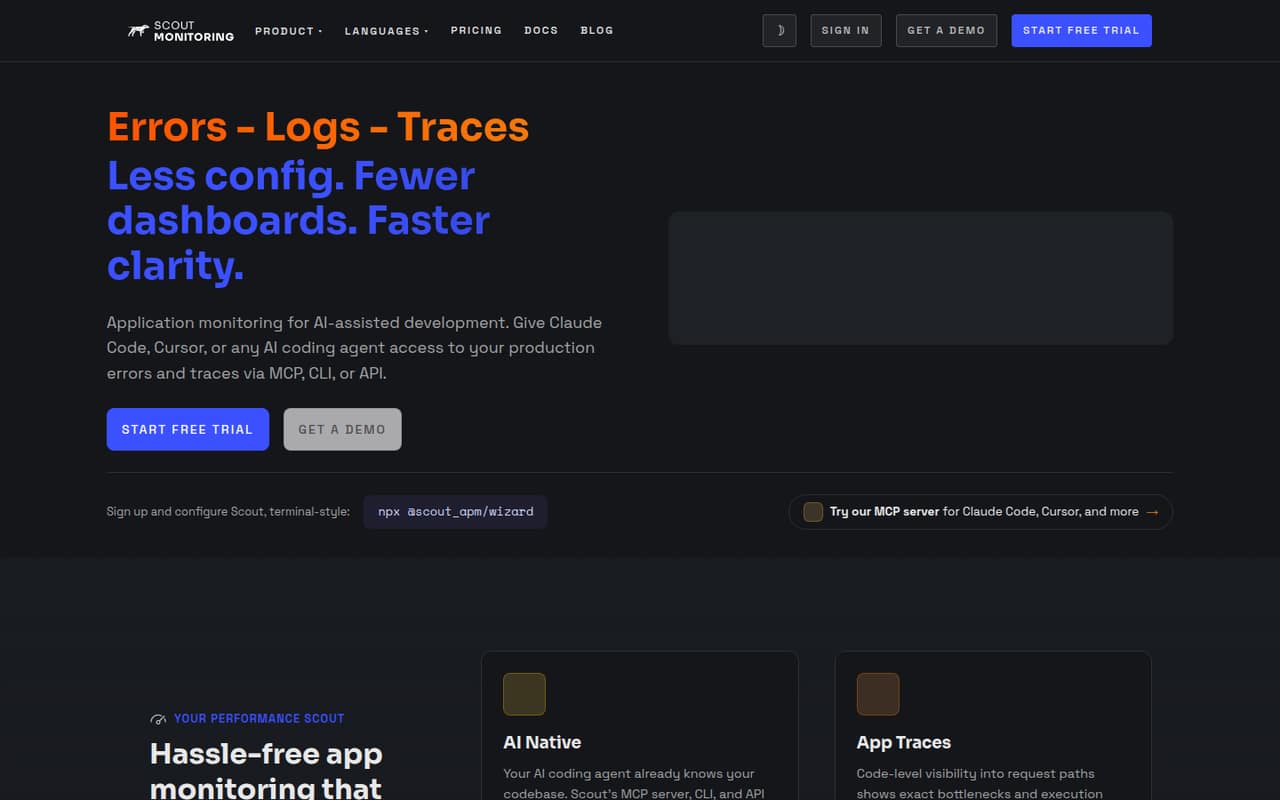
- Best for application debuggingScout APMScout APM
Scout APM is a focused option for teams using its supported application languages and looking for integrated APM. Its listed fit includes developers debugging with coding agents. A free plan is available, with a $19 starting price. Check supported languages, agent access and plan limits against the services you intend to monitor before adopting it across a codebase.
What works
- MCP, CLI and API access for coding agents
- Traces connect request paths to code-level bottlenecks
- Logs, errors and performance data share one interface
What doesn't
- Most paid plans include only 1 GB of logs
- Most paid plans include 5,000 errors
- Only Production Ready lists 14-day log retention
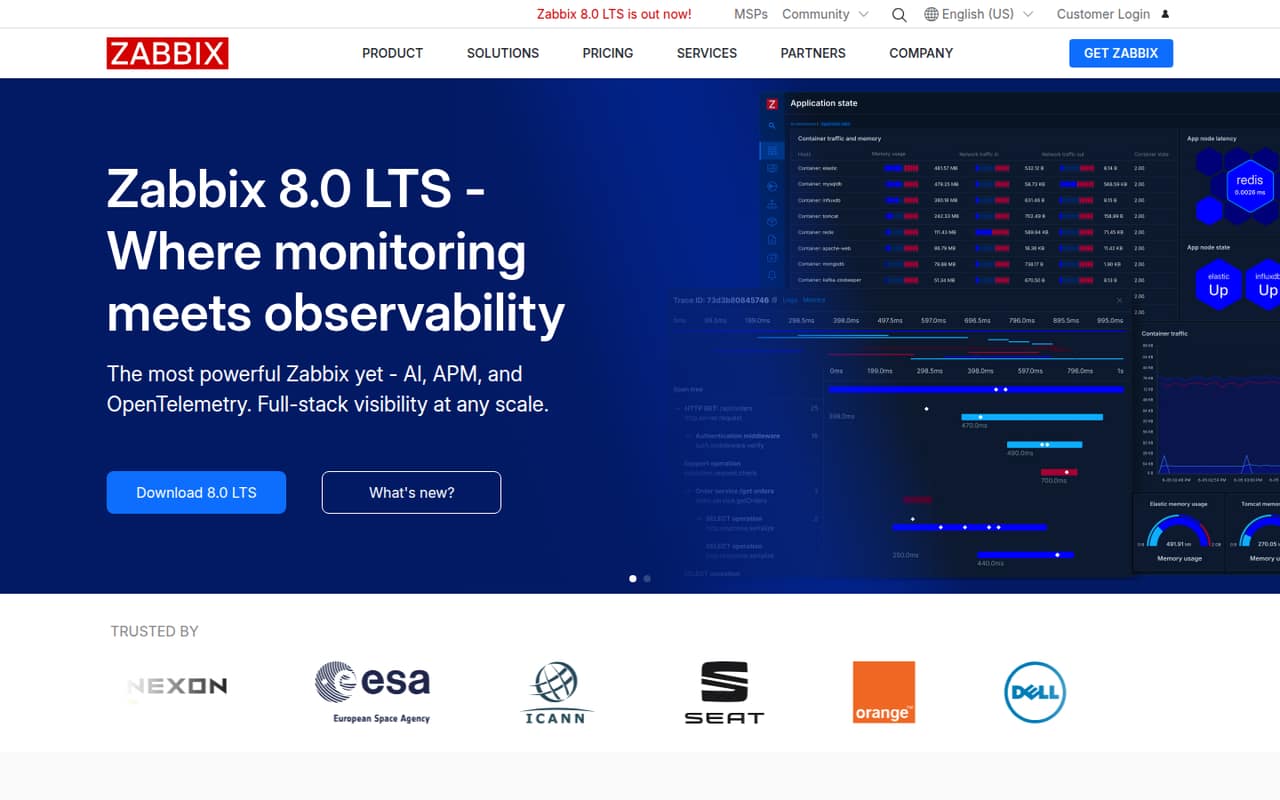
- Best self-hosted infrastructureZabbixZabbix
Zabbix is open source and self-hostable, with a free plan and no listed starting price. It fits teams avoiding per-device license fees and organizations willing to configure and tune their own infrastructure monitoring. Compare its operational workload with hosted alternatives: software fees are only one part of the cost when your team runs the monitoring service.
What works
- Self-hosted open-source option costs $0
- Pricing page lists unlimited hosts, users, metrics, and alerts
- Supports on-premise, managed cloud, and public cloud deployment
What doesn't
- Reddit users report setup and tuning take time
- Alert noise can require careful trigger configuration
- Homepage does not name API protocols or SDKs
- Best hybrid infrastructureCheckmkCheckmk
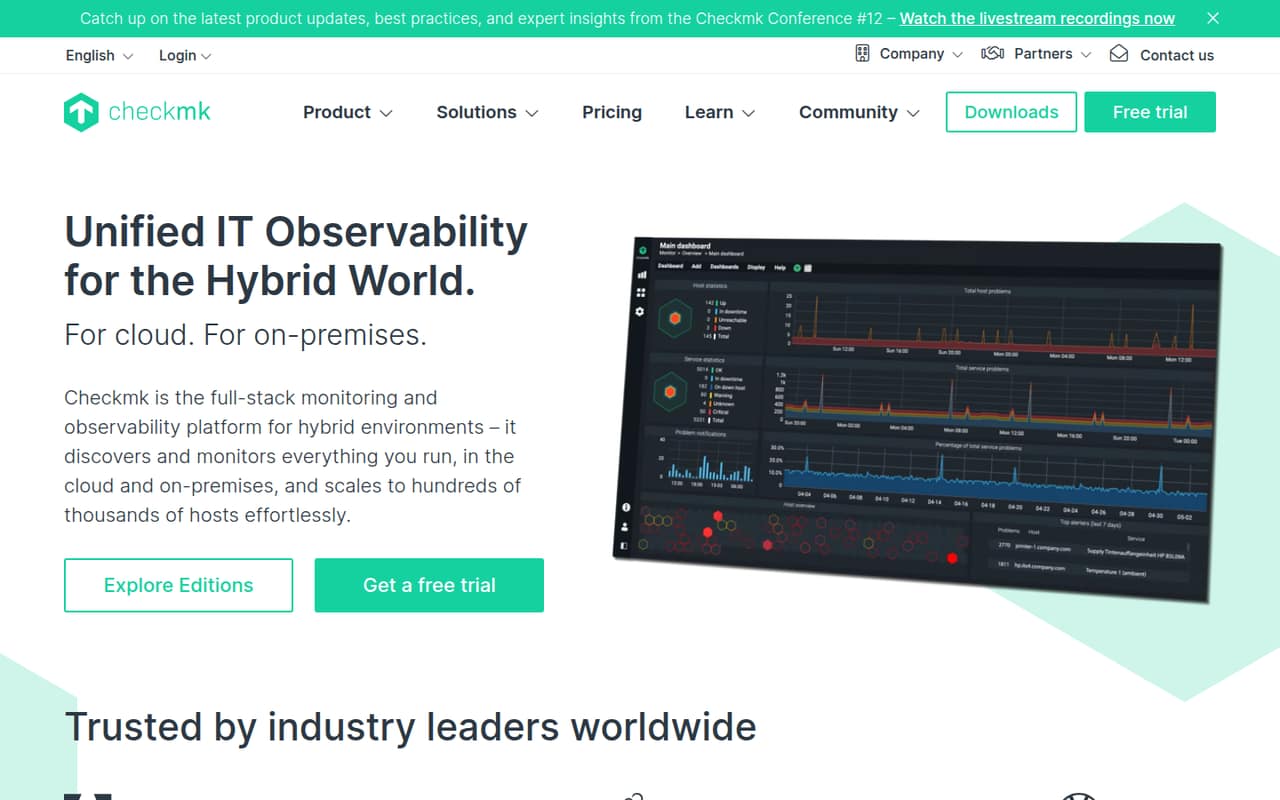
Checkmk is an open-source, self-hostable option for hybrid infrastructure monitoring, with a free edition and host-level discovery among its stated strengths. It suits teams that want to control deployment and monitor varied environments. Its learning curve is a stated drawback, so account for setup and ongoing administration alongside license costs when comparing it with hosted services.
What works
- More than 2,000 integrations
- Community edition is free and open source
- On-premises, air-gapped, and SaaS deployment options
What doesn't
- Configuration has a learning curve
- Reddit users report unintuitive and slow UI
- SDK languages and API protocol are not named
- Best for self-hosted logsGraylogGraylog
Graylog is a self-hostable log platform for teams that want to operate their own logging service, including air-gapped deployments. It has a free plan; the listed starting price is $1,250, while paid SIEM starts at $18,000 a year. Confirm which edition fits your security and logging requirements, and budget for operating the underlying deployment.
What works
- Graylog Open is permanently free
- No volume restrictions on Graylog Open
- Deploy in cloud or on your own racks
What doesn't
- Enterprise starts at $15,000 per year
- Security starts at $18,000 per year
- Self-hosting adds infrastructure and maintenance work
- Best for cloud-stored telemetryCoralogixCoralogix
Coralogix is a usage-priced observability platform built around customer-cloud storage, with cross-signal investigation and CLI-driven automation among its stated fits. That architecture may appeal to teams with requirements around where telemetry is stored. Its starting price is not published. Ask for a cost model based on your volume, retention and required integrations before committing.
What works
- Stores telemetry in your cloud in open formats
- Logs, traces, metrics and AI have separate usage rates
- 14-day trial includes all features
What doesn't
- No ongoing free plan
- SDKs and supported languages need confirmation
- Pay-As-You-Go rate is not published
03How we chose
We ranked platforms for engineering teams by architectural fit, stated API and SDK coverage, documentation considerations, free-tier availability, usage pricing, open-source licensing and self-hosting options. We favored tools with a clear path to integrate with application telemetry and a deployment model teams can evaluate against their stack. Published starting prices are not treated as production estimates: ingest, users, retention or infrastructure can change total cost. Reddit sentiment is a secondary signal for reported operational friction, not a substitute for vendor plan terms. We make no claims of hands-on testing.
04Match the architecture to your team
Start by deciding what you want to operate. A hosted platform reduces the need to run the observability service, but puts telemetry and cost controls inside a vendor’s plan. A self-hosted option gives your team more control over deployment and storage, while making upgrades, capacity and availability your responsibility. Open source does not mean zero operating cost.
Then map the tool to the signals and workflows your codebase needs. Check language support, agent or SDK coverage, ingestion protocols, alert routing and data export in the vendor’s documentation. If a required integration is unclear, ask the vendor for its exact support status and maintenance expectations. For tools with OpenTelemetry or Prometheus support, verify which signals and features are supported rather than assuming compatibility covers every use case. Include incident response and status communication only if your team needs those workflows in the same platform.
05Model production cost and exit paths
Treat a listed starting price as an entry point, not a forecast. Estimate telemetry by signal, expected volume and retention, then confirm whether charges also depend on users, hosts or other units. Ask how overages are handled, whether sampling changes billing, and what happens when a free allowance is exceeded. Get the estimate in writing for the plan and deployment you would use.
Before sending production data, confirm retention, export formats and deletion behavior. Ask whether you can export raw events and dashboards, and what remains usable if you leave the service. For self-hosted deployments, check the license and the work needed to operate storage and upgrades. For hosted deployments, review the service’s documented limits and support terms. A proof of concept should include a realistic service and telemetry pattern, not just a dashboard that looks useful with sample data.
Questions people ask
Which observability platform is best for developers?
Grafana is our best overall pick for teams consolidating telemetry and building dashboards. Prometheus is a strong open-source choice when teams want local metric storage and can run the servers. For distributed-system investigation, consider Honeycomb; compare its free-plan limits and usage pricing with expected telemetry.
Which observability tools are open source and self-hostable?
Prometheus, Grafana, Zabbix and Checkmk are listed as open source; Prometheus, Zabbix and Checkmk are also listed as self-hostable. Graylog is listed as self-hostable. Check each project’s license and the terms for the specific edition you plan to deploy before building around it.
How much do observability platforms cost?
Listed starting prices range from $0 for Prometheus to $500 for Datadog among these picks, but the figures do not establish a production bill. Several tools offer free plans, and some do not publish a starting price. Estimate usage, retention and user costs with the vendor’s current plan terms.
What should I check before choosing an observability API?
Verify SDKs and language support for your services, supported telemetry protocols, rate and ingestion limits, and how alerts integrate with your response workflow. Review data export and retention terms too. If the documentation does not answer a production requirement, ask the vendor to confirm it for your intended plan.