
We may earn a commission if you buy through links on this page. It never changes a score or a ranking. How we make money
The bottom line
A broad observability platform with a useful free tier and bills that grow with telemetry use.
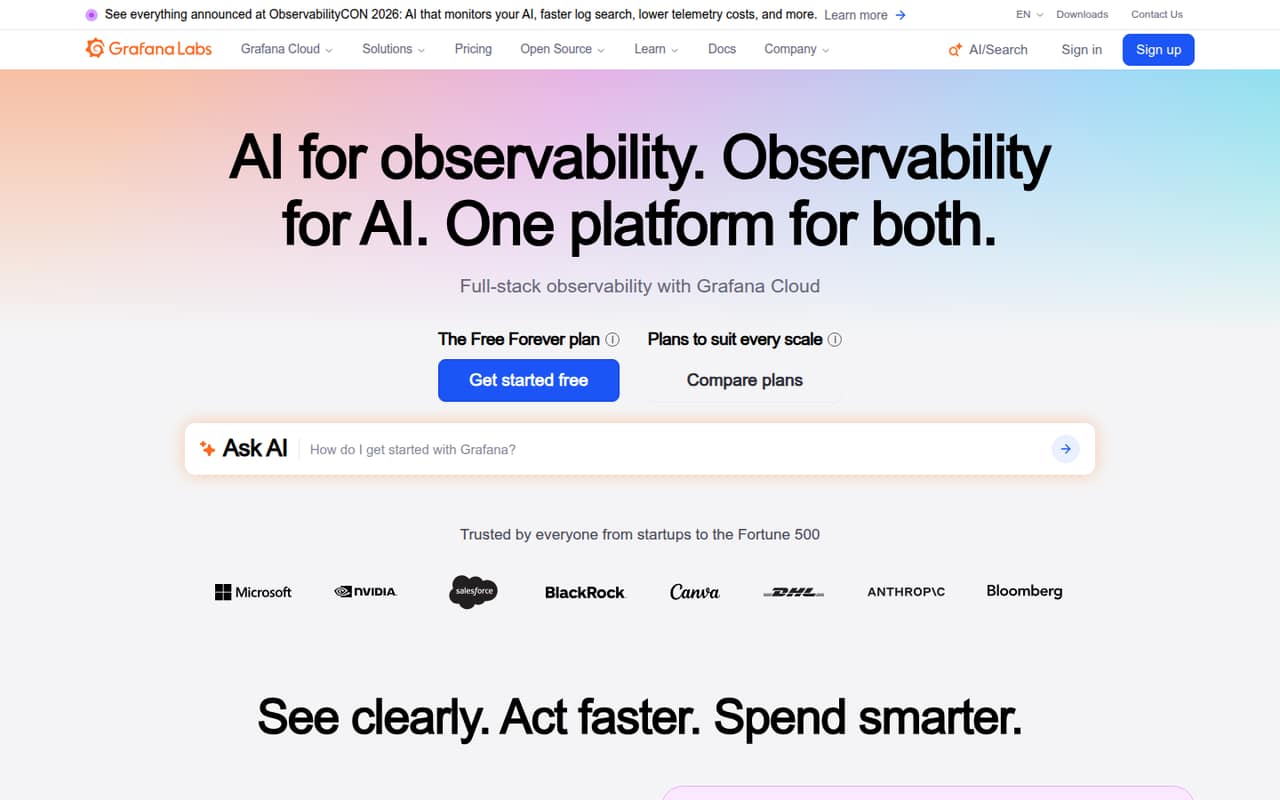
Grafana is an observability platform available as Grafana Cloud. It brings logs, metrics, traces and profiles together, with dashboards, incident response, testing and AI operations built around telemetry standards including OpenTelemetry and Prometheus.
The Free plan is a practical starting point, but production costs can rise with data volume and product usage. Reddit users praise the flexibility while reporting dashboard upkeep, panel configuration and alerting complexity.
Good fit if
- Teams consolidating telemetry signals
- Organizations using OpenTelemetry or Prometheus
- Teams needing dashboards and AI operations
Skip it if
- Teams wanting zero dashboard maintenance
- Small setups needing minimal monitoring
- Buyers needing predictable, flat pricing
ScoresHow it rates
What works
- Unifies logs, metrics, traces and profiles
- Free plan includes 10k active metric series monthly
- Built around OpenTelemetry and Prometheus
- Hundreds of plugins and integrations
- Adaptive Telemetry targets unnecessary data costs
What doesn't
- Pro adds usage charges beyond a $19 monthly platform fee
- Included Pro usage varies by product
- Dashboard setup and upkeep can take time
- The homepage does not name SDKs or programming languages
- License and data-export terms need confirmation
01What Grafana is, technically
Grafana is an observability platform offered as Grafana Cloud, a hosted service for bringing telemetry into dashboards and operational workflows. It is not just a charting library: the platform covers logs, metrics, traces and profiles, plus incident response, testing, synthetic monitoring and cost management.
In a typical stack, telemetry comes from services and infrastructure, then Grafana Cloud provides a shared place to explore and visualize it. The vendor describes the platform as OpenTelemetry-native and says it is built on open standards including OpenTelemetry and Prometheus. It also promotes a Knowledge Graph to connect telemetry signals with shared context. Grafana Assistant helps teams understand production telemetry; Investigations supports root-cause analysis; Agent Observability covers production AI agents. Adaptive Telemetry is intended to identify data to keep and aggregate the rest. That scope can reduce tool sprawl, but teams still need to plan instrumentation, dashboards and usage costs.
02Grafana API, SDKs and docs
The integration surface the vendor names is standards-based telemetry: OpenTelemetry and Prometheus, along with hundreds of plugins and integrations for connecting existing tools and data sources. That gives teams a way to fit Grafana Cloud around an existing stack rather than replace every component. The homepage does not name particular APIs, SDKs, programming languages or a CLI, so confirm supported client libraries, API endpoints and automation workflows in Grafana’s documentation before choosing an implementation.
Grafana’s core developer work is likely to include instrumenting services, connecting data sources, and building or maintaining dashboards and alerts. That last part can take effort: Reddit users describe importing dashboards and learning from their queries, while others report panel configuration and alerting-interface friction. One thread describes a week of evening and weekend work to assemble a homelab dashboard. Treat prebuilt dashboards and plugins as a starting point, not a guarantee that your team’s views and alert rules will be ready to use.
03Grafana pricing for developers
The Free plan costs $0 and includes 14-day retention for metrics, logs, traces, profiles and k6, plus 10k active metric series per month and 50 GB per month for logs, traces and profiles. It includes community support. Pro starts at a $19 monthly platform fee, then adds pay-as-you-go charges above included usage; the listed retention is 13 months for metrics and 30 days for logs, traces and profiles. The pricing page does not list annual billing prices.
Usage prices vary by product. Metrics Pro starts at $6.50 per 1k series. Logs Pro costs $0.050 per GB processed, $0.400 per GB written and $0.100 per GB retained. Traces and Profiles use the same listed rates. Kubernetes Monitoring is $0.01 per host hour and $0.0007 per container hour. Grafana Assistant Pro costs $20 per active AI user, including 40M tokens per user per month; extra tokens cost $2 per 1M. Enterprise requires a $25,000 annual spend commit, with custom retention and support.
04Grafana: open source, self-hosting and lock-in
Grafana says its cloud is built on open source and points visitors to its OSS projects. The homepage does not name the applicable licenses, so check each project’s license before embedding or redistributing it. The product is presented primarily as Grafana Cloud; Enterprise plans list Public Cloud, Federal Cloud or Bring Your Own Cloud deployment. Confirm with Grafana which deployment options apply to the software and services you plan to use.
The vendor promotes OpenTelemetry, Prometheus and hundreds of plugins and integrations, which can reduce dependence on proprietary collection formats. That does not establish a complete exit path. The homepage does not describe a data-export process or migration tooling, so ask how to export dashboards, rules and stored telemetry, and what formats are supported. Your exit effort will depend on the data sources, storage and integrations in your stack, not just the visualization layer.
05Grafana in production
Before rolling Grafana Cloud out broadly, model the bill against telemetry volume and retention: Pro combines a monthly platform fee with product-specific usage charges. Check included allowances, overage behavior and expected data growth for each product you plan to enable. The pricing information lists support tiers—community support on Free, 8×5 email support on Pro and premium support on Enterprise—but does not give a service-level target. Ask Grafana about availability commitments, rate limits and incident handling for your deployment.
The homepage lists FedRAMP, NATSEC100, PCI DSS, A-LIGN, AICPA SOC Type II and GDPR credentials; verify which certifications and controls apply to your chosen service and data. Reddit users report that dashboards can take time to build and maintain, and some describe panels as requiring too much tweaking. A self-hosted Prometheus and Grafana setup can also require alert-writing and operational work, according to network-monitoring discussions. Validate alert workflows and ownership before relying on them during incidents.
From the threadsWhat users say
Reddit sentiment is mixed: users value the flexibility and share useful dashboards, but some find panels, alerts and ongoing dashboard work cumbersome. These comments cover varied setups, not a representative customer survey.
Personally I find it hard to use panels in a straightforward way. It takes too much tweaking to get simple panels to do what I want
I don't know what happened, but I feel like the alerting interface became worse and more complicated in newer versions
I am monitoring proxmox host, VMs, docker host and PiHole with it. I find it really really helpful and it already helped me tweak a few things
Questions people ask
Is Grafana free?
Yes. The Free plan costs $0 and includes 10k active metric series per month, 50 GB per month for logs, traces and profiles, and 14-day retention for metrics, logs, traces, profiles and k6. It includes community support. Usage beyond the listed limits may require a paid plan.
What is the price of Grafana Enterprise?
Grafana Enterprise requires a minimum $25,000 annual spend commit. The plan lists custom retention, premium support and Public Cloud, Federal Cloud or Bring Your Own Cloud deployment. Enterprise pricing for several usage-based products is custom; ask Grafana for a quote based on your expected usage.
Is Grafana Assistant free?
The pricing page lists Grafana Assistant Pro at $20 per active AI user, including 40M tokens per user per month. Additional tokens cost $2 per 1M tokens. The Free plan includes the platform’s free-tier limits, but the listed Assistant price is a Pro add-on.
How does Grafana charge for usage?
Pro starts with a $19 monthly platform fee, then charges for usage above included allowances. Rates depend on the product: for example, Logs Pro charges by processed, written and retained gigabytes. Enterprise has a $25,000 annual minimum commit, with custom pricing for usage-based products.
How long does Grafana retain telemetry?
The Free plan lists 14-day retention for metrics, logs, traces, profiles and k6. Pro lists 13 months for metrics and 30 days for logs, traces and profiles. Enterprise offers custom retention, so confirm the terms for your required data types and deployment.