
We may earn a commission if you buy through links on this page. It never changes a score or a ranking. How we make money
The bottom line
Prometheus gives you open-source metrics and PromQL without usage fees, but you run the servers.
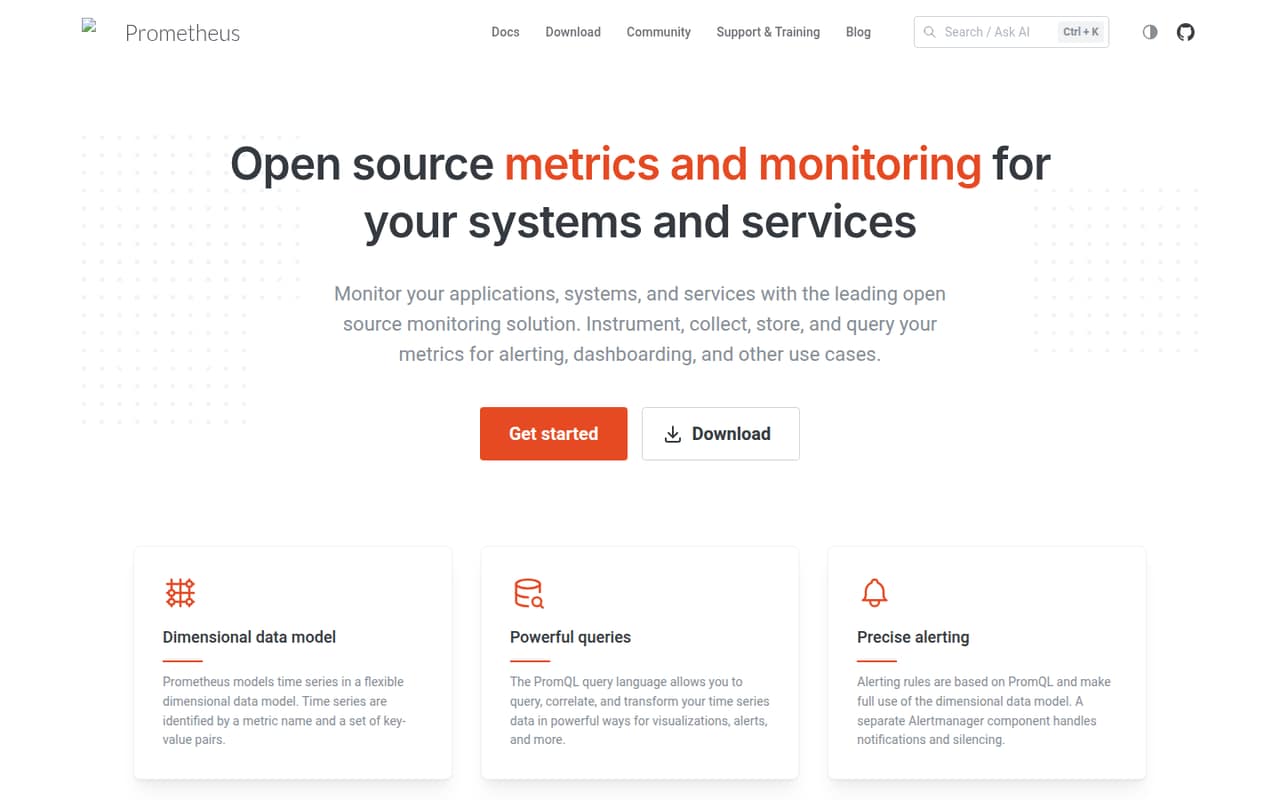
Prometheus is an open-source metrics server you deploy and operate. It collects, stores and queries time series, with PromQL-based alert rules and a separate Alertmanager component for notifications and silencing.
The price is hard to beat: the Open Source plan is free, with no seat or usage limits. The trade-off is operational ownership. Servers rely on local storage and run independently, so teams must plan deployment, storage and scaling around their own systems.
Good fit if
- Teams monitoring systems and services
- Kubernetes and cloud-native environments
- Teams that want local metric storage
Skip it if
- Teams seeking a hosted monitoring service
- Projects needing vendor-managed scaling
- Teams without monitoring operations capacity
ScoresHow it rates
What works
- Free, open source and Apache 2.0 licensed
- Dimensional time-series model with key-value labels
- PromQL queries and alerting rules
- Instrumentation libraries cover most major languages
- Hundreds of integrations extract metrics from existing systems
What doesn't
- Servers depend on local storage
- Teams operate and scale the servers themselves
- Homepage does not name an API protocol
- Support commitments are not stated on the homepage
- Scaling limits and guidance need production validation
01What Prometheus is, technically
Prometheus is an open-source monitoring server that you deploy and operate, not a hosted API or SaaS application. It instruments applications and systems through metrics libraries and integrations, collects time-series data, stores it locally and lets you query it with PromQL. It sits alongside the services being monitored and can feed visualizations and alerting workflows.
Its data model identifies a time series by a metric name and key-value pairs. PromQL can query, correlate and transform those series. Alerting rules use PromQL and the same dimensional model; a separate Alertmanager component handles notifications and silencing. Prometheus servers operate independently and rely on local storage. The project is designed for cloud-native monitoring and integrates with Kubernetes and other cloud and container managers to discover and monitor services. That architecture suits teams that want control over collection and storage, and are prepared to own the server deployment.
02Prometheus API, SDKs and docs
The core developer workflow is instrumentation, collection and querying. Prometheus provides official and community-contributed instrumentation libraries that cover most major languages, plus hundreds of integrations for extracting metrics from existing systems. The homepage names Go as the language Prometheus itself is developed in; it does not name specific client-library languages or a public API protocol. Confirm the language-specific library and API support you need in the vendor’s documentation.
PromQL is the query language for querying, correlating and transforming time series, and alerting rules use it too. For infrastructure integrations, Prometheus can discover and monitor services in Kubernetes and other cloud and container managers. Its statically linked binaries are intended for deployment across varied environments. The homepage does not identify a CLI or SDK package list, so check the documentation for installation and client details before choosing an integration path. Prometheus is a CNCF graduated project, with components available on GitHub under Apache 2.0.
03Prometheus pricing for developers
The Open Source plan costs $0 per month and includes the Apache 2.0 license, with no seat limits or usage limits. The pricing page lists no paid tiers, add-ons, overages or separate monthly and annual billing. Prometheus itself therefore does not add a per-seat or per-request charge as metric volume grows.
That does not make a production deployment cost-free. Servers rely on local storage, so teams operating Prometheus must account for the infrastructure and engineering work needed to run it. Those costs depend on your deployment; the vendor does not publish infrastructure prices or a cost calculator. The pricing page lists no usage-based bill, but it also does not give production sizing guidance or storage costs. Budget for the environment you operate, and validate capacity against your own collection and retention needs. There is no listed free trial because the open-source software is free to use.
04Prometheus: open source, self-hosting and lock-in
Prometheus is fully open source and community-driven, and its components are available on GitHub under the Apache 2.0 license. Its servers operate independently and rely on local storage, so teams can deploy and run them in their own environments rather than depending on a Prometheus-hosted service.
The metric model and PromQL are central to how teams instrument, query and alert. Moving away may mean adapting instrumentation, queries and alert rules to another system. The vendor does not publish a data-export workflow on its homepage, so verify how to extract stored data and preserve the history you need before planning a migration. Open source gives teams access to the components, but does not by itself make stored data or dashboards portable.
05Prometheus in production
Prometheus servers operate independently and rely on local storage. That keeps deployment self-contained, but puts storage management and operational planning on the team. The homepage describes Kubernetes and other cloud and container-manager integrations for discovering and monitoring services; it does not set production scale limits. Test your expected collection and retention requirements in your own environment, and plan for local storage capacity and recovery.
Reddit feedback is mixed. One commenter says their team chose Prometheus because of prior experience and reported low maintenance. Another says Prometheus may stop fitting at larger scale, while a separate commenter notes it is not meant to scale to that extent on its own. These are individual reports, not published capacity guarantees. The vendor does not publish security or compliance commitments on its homepage. Teams with regulated workloads should review deployment controls and compliance requirements before relying on it.
From the threadsWhat users say
Reddit sentiment leans toward sticking with Prometheus when it meets the team's needs and is familiar to the operators. Comments also flag that teams may outgrow a standalone Prometheus deployment.
ended up going Prom cause thats what our team had experience with in the past
The prometheus setup was smooth, and we have pretty much put zero time into it
At certain point Prometheus just doesn’t cut it any more
If you aren't facing a specific problem, don't do the work
Questions people ask
What is Prometheus used for?
Prometheus is used to instrument, collect, store and query metrics from applications, systems and services. Teams use its time-series data for visualizations, alerting and other monitoring needs. Its integrations can extract metrics from existing systems, and it supports service discovery for Kubernetes and other cloud and container managers.
Is Prometheus open source?
Yes. Prometheus is open source and community-driven. Its components are available on GitHub under the Apache 2.0 license. The Open Source plan is free, with no seat or usage limits listed.
How does alerting work in Prometheus?
Prometheus alerting rules use PromQL and the dimensional time-series data model. A separate component, Alertmanager, handles notifications and silencing. Teams define rules against their metrics and configure how resulting alerts should be handled.
Does Prometheus work with Kubernetes?
Yes. Prometheus is designed for cloud-native monitoring and integrates with Kubernetes and other cloud and container managers. Those integrations can continuously discover and monitor services. The project also offers hundreds of integrations for extracting metrics from existing systems.
Can I use Prometheus without paying?
Yes. The Open Source plan costs $0 per month and has no listed seat or usage limits. You still need to account for the infrastructure and operational work involved in deploying and running servers that rely on local storage.