
We may earn a commission if you buy through links on this page. It never changes a score or a ranking. How we make money
The bottom line
Useful real-time newsroom analytics, with custom pricing and integration details to confirm before adoption.
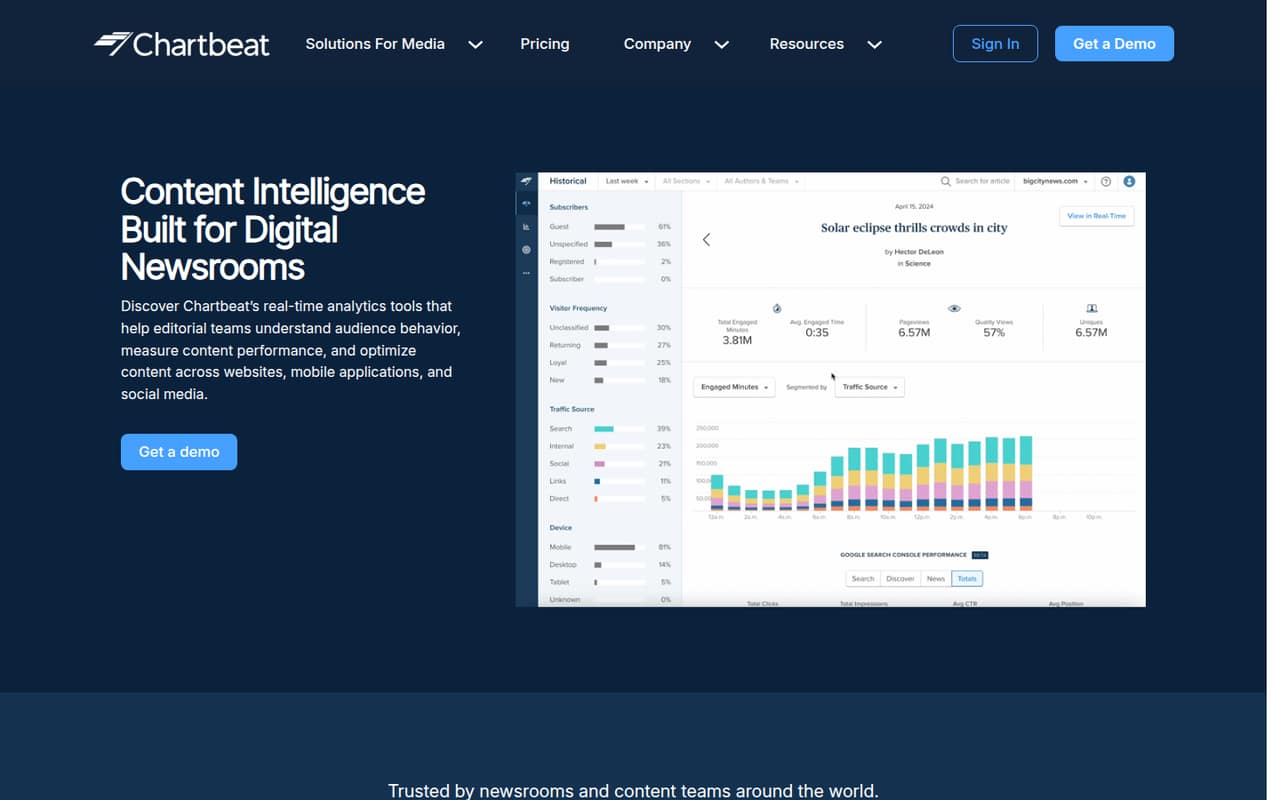
Chartbeat is a hosted analytics service for publishers, built around real-time and historical views of website and app content performance. Its dashboards cover engaged time, referral traffic, scroll depth and recirculation, with tools for headline and image testing, alerts and reporting.
The editorial focus is clear, but developers should confirm the measurement setup, SDK support and data controls with Chartbeat before planning an implementation. Pricing is customized by website and native app pageviews; the vendor does not publish plan prices.
Good fit if
- Digital newsrooms tracking live story performance
- Editorial teams optimizing headlines and placement
- Publishers comparing historical content trends
Skip it if
- Teams needing a self-hosted analytics stack
- Buyers requiring published, fixed pricing
- Developers seeking documented API-first tooling
ScoresHow it rates
What works
- Real-time audience and referral traffic dashboards
- Tracks engaged time, scroll depth and recirculation
- Historical trends cover up to 13 months
- Unlimited seats across listed pricing tiers
- Reports can be customized, scheduled and exported
What doesn't
- Monthly and annual plan prices are not published
- Pricing scales with website and app pageviews
- SDKs, languages and API details need confirmation
- No open-source licence or self-hosting option is stated
- A Reddit thread reports differing analytics figures
01What Chartbeat is, technically
Chartbeat is a vendor-hosted content analytics service for digital publishers, presented as dashboards and optimization tools rather than as a library, CLI or self-hosted server. It measures audience behavior across publisher websites and mobile apps, with the goal of helping editorial teams make decisions while stories are attracting traffic.
In a publisher’s stack, Chartbeat sits alongside the website or app measurement layer and gives editorial, audience and product teams a view of content performance. Its real-time dashboard shows concurrent pageviews, unique visitors, engagement and referral traffic. The Heads Up Display adds story-level performance, scroll depth and comparisons by placement. Historical reporting covers 13 months of trends in engaged time, traffic and topic data. Other tools cover headline and image testing, alerts and reporting. The homepage also describes audience insights across social media, but the named measurement metrics focus on publisher sites and apps. It is aimed at newsroom workflows, not a general-purpose event pipeline.
02Chartbeat API, SDKs and docs
Chartbeat’s documented product surface on its homepage is its analytics dashboards and tools for websites and mobile applications. The page describes real-time tracking across sites, a Heads Up Display for article performance, historical analysis, scheduled and exportable reports, and testing tools. It does not present a named API, protocol, SDK, programming language, CLI or plugin as the integration path.
Treat implementation as a measurement integration for your publisher site or app, not as a documented API-first dependency. Before estimating work, ask Chartbeat for the current installation instructions, supported SDKs and languages, event or tag requirements, and how to verify that all pages and app surfaces are tracked. Confirm whether the reports you need can be exported in your preferred format. The vendor’s public product overview does not establish REST API or webhook support, so confirm those capabilities in Chartbeat’s technical documentation rather than designing around them.
03Chartbeat pricing for developers
The pricing page lists four tiers: Essentials, Plus, Premium and Enterprise. Monthly and annual prices are not published, and the vendor says pricing is customized according to website and native app pageviews. There is no listed free plan or free trial, so ask for a quote based on your expected traffic and app usage before budgeting.
All four tiers list unlimited seats. Essentials includes historical performance tracking for up to 13 months. Plus includes a choice of one Performance Suite; Premium includes a choice of three; Enterprise includes all four. The suites are Reader Experience, Testing, Benchmarking and Analytics Pro. The pricing information does not publish standalone suite prices or overage costs.
For a production budget, pageview volume is the stated pricing driver, rather than seat count. Ask how website and app pageviews are counted, how growth changes the quote, and whether any usage thresholds or overages apply. The vendor does not publish enough pricing detail to calculate a reliable starting cost.
04Chartbeat: open source, self-hosting and lock-in
Chartbeat’s product overview does not state an open-source licence or describe a self-hosted deployment. Treat it as a vendor-hosted analytics service, not a package you can run inside your own infrastructure, unless Chartbeat confirms another deployment option. The vendor does not publish a public migration path or data portability guarantees in the product overview.
Chartbeat says reports can be exported, which gives teams a way to take report data out. That is not the same as a documented bulk export of raw events, configuration or historical data. Before signing, ask what data can be exported, in which formats, and whether exports include the full 13-month history. Also clarify how long data remains available after cancellation. If you leave, you should expect to replace the measurement implementation and rebuild newsroom dashboards or workflows that depend on Chartbeat-specific metrics.
05Chartbeat in production
The vendor describes real-time dashboards and alerts for unusual audience spikes and dips, but does not publish service limits or reliability commitments in its product overview. Before relying on it for newsroom decisions, ask about availability targets, support response times, data delays, pageview counting and what happens when traffic surges. Confirm how the measurement setup covers homepages, article pages and mobile apps.
One Reddit thread describes Chartbeat and another analytics tool reporting different traffic sources and Saturday patterns. Commenters suggest checking whether tracking covers all pages and asking Chartbeat Support; the thread does not establish a cause. Treat discrepancies as a measurement and configuration issue to investigate, not as proof that one report is correct. For security and compliance review, ask Chartbeat about consent controls, data retention, processing locations and contractual terms. The vendor’s homepage does not provide those operational details.
From the threadsWhat users say
The small amount of Reddit discussion is mixed. One commenter describes using Chartbeat spikes alongside another analytics tool, while another thread raises questions about differences in reported sources and tracking coverage; a separate post criticizes the cost for independent publishers.
For the place I work, we get a mix of sources and can clearly identify when there is a spike on CB and verify on GA eventually
It shouldnt be widely different. But interms of sources i’d go with Chartbeat
Does your CB track all pages or just some? I’ve seen some people just implement it on article pages. Example: does it track your homepage?
Chartbeat does this beautifully — but at a price that makes no sense for independent publishers
Questions people ask
How much does Chartbeat cost?
Chartbeat does not publish monthly or annual prices. The vendor says pricing is customized according to website and native app pageviews. Essentials, Plus, Premium and Enterprise list unlimited seats, but the pricing information does not state starting prices or overage costs. Ask for a quote based on your traffic and app usage.
What does Chartbeat measure?
Chartbeat measures publisher content performance across websites and mobile apps. Its listed metrics include engaged time, referral traffic, scroll depth and recirculation, alongside concurrent pageviews and unique visitors in the real-time dashboard. The vendor also describes audience insights across authors, topics and sections.
How far back does Chartbeat keep historical trends?
Chartbeat’s homepage describes a Historical Dashboard with 13 months of trends in engaged time, website traffic, topic-based data and other measures. Essentials also lists historical performance tracking for up to 13 months. Ask Chartbeat whether your required reports and exports include the full period.
Does Chartbeat offer headline testing and alerts?
Yes. Chartbeat lists headline and image testing, plus recommendation widgets powered by reader-preference data. It also describes real-time alerts for unusual audience spikes and dips. The product overview does not give testing-volume limits or alert-delivery guarantees, so confirm those details for your expected traffic and workflow.
Can Chartbeat data be exported?
Chartbeat says its advanced reporting tools let teams customize, schedule and export reports. The vendor’s product overview does not describe a bulk raw-event export or specify export formats. If data portability matters for a migration or warehouse pipeline, ask what fields, history and formats are available before committing.
Sources
- Chartbeat homepage
- Chartbeat pricing, compiled via web search from chartbeat.com, wireboard.io
- Reddit: GA and ChartBeat Inconsistency
- Reddit: [REVIEW] [FREE] I got tired of paying $$$ for Chartbeat so I built my own — free, open source, self-hosted live analytics for WordPress. Would love your feedback.
- Reddit: Real Time Analytics Review: Woopra vs Chartbeat vs Reinvigorate vs Statcounter
- Reddit: [REVIEW] [FREE] I got tired of paying $$$ for Chartbeat so I built my own — free, open source, self-hosted live analytics for WordPress. Would love your feedback.