
We may earn a commission if you buy through links on this page. It never changes a score or a ranking. How we make money
The bottom line
A cost-conscious, unified observability platform with a free self-hosted core and production details to verify.
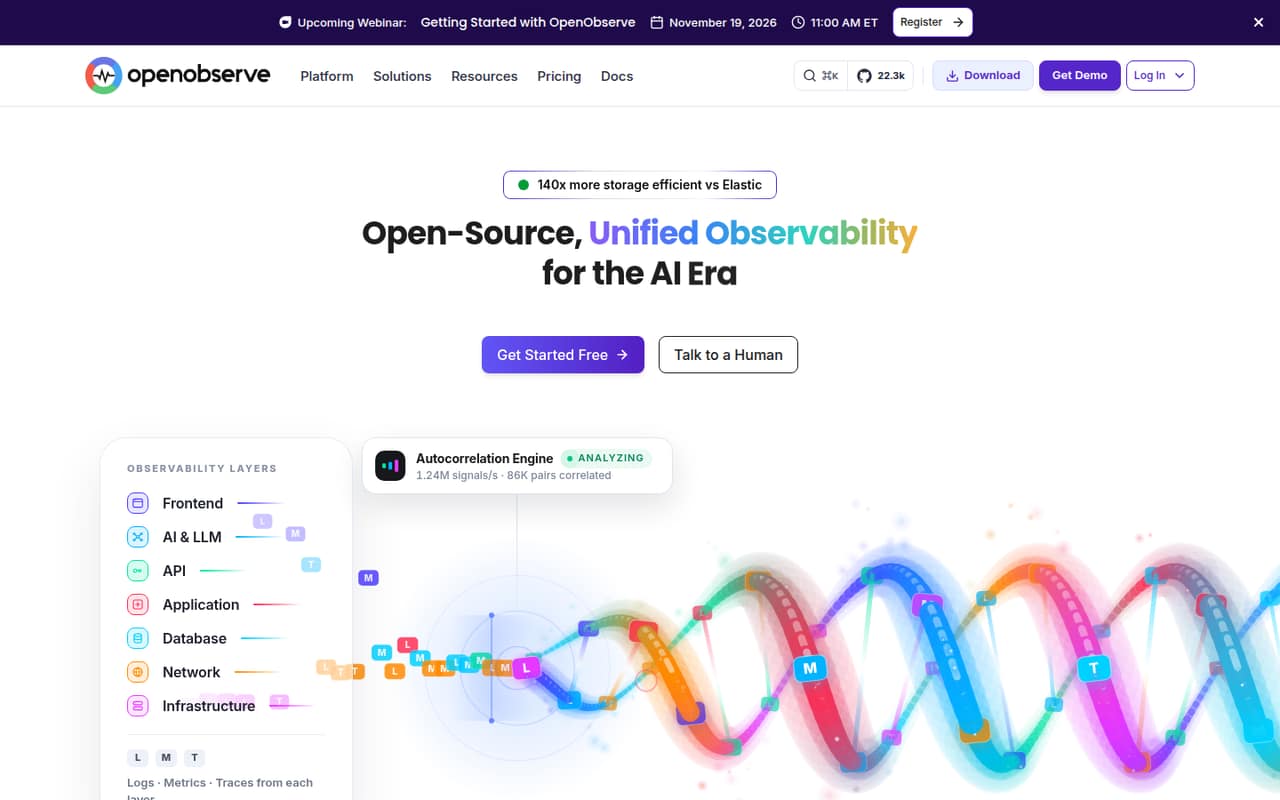
OpenObserve is an observability platform for logs, metrics, traces and AI workloads, available as managed Cloud or self-hosted software. It combines SQL log search, Prometheus-compatible metrics, distributed tracing, dashboards and alerts; the homepage also promotes AI incident triage and LLM observability.
The free AGPL-3.0 edition and usage-priced Cloud option are attractive for teams consolidating telemetry. Cloud Professional lists $0.50/GB ingested with an annual commitment, plus query and retention charges. Check SDK support, rate limits and security requirements with the vendor before committing; Reddit reports on resource use and search performance vary.
Good fit if
- Teams consolidating logs, metrics and traces
- Self-hosters needing a free observability core
- SQL-based log search with Parquet storage
Skip it if
- Teams requiring published SDK coverage
- Buyers needing known rate limits upfront
- Teams needing free SSO and RBAC
ScoresHow it rates
What works
- Free self-hosted edition under AGPL-3.0
- Logs, metrics and traces in one platform
- SQL log queries with columnar Parquet storage
- Cloud pricing scales with ingestion and queries
- Prometheus-compatible metrics and Grafana board import
What doesn't
- Cloud has no published fixed monthly price
- Cloud query and extra-retention charges add up
- Self-hosted Enterprise above 50 GB/day requires sales
- SDK and language support needs confirmation
- Reddit reports differ on memory use and performance
01What OpenObserve is, technically
OpenObserve is an observability platform delivered as a managed Cloud service or self-hosted software. It sits between telemetry producers and the engineers investigating service behavior: ingest logs, metrics and traces, query and correlate them, then build dashboards or alerts. The product also targets AI workloads, with tools for LLM tracing and an AI SRE agent.
For logs, OpenObserve describes SQL queries over columnar Parquet storage, built in Rust on the DataFusion engine. Metrics are Prometheus-compatible; distributed traces carry context and are correlated with logs and metrics. The unified model is intended to reduce the need to operate separate tools for each signal. Its homepage also lists SLOs, real user monitoring and synthetic monitoring. The open-source edition can run self-hosted; teams that prefer a managed service can use Cloud, with ingestion and query charges. The product is an observability backend and user interface, not a language-specific logging library.
02OpenObserve API, SDKs and docs
The integration surfaces named by OpenObserve include Prometheus-compatible metrics, PromQL support reported by a commenter on r/rust, and OpenTelemetry support reported in the same thread. The homepage says teams can bring existing Grafana boards over and route alerts to Slack, PagerDuty, email and other destinations. It also describes SQL as the query language for log search.
The homepage does not name programming-language SDKs or a CLI. Before choosing an implementation, confirm API endpoints, supported SDKs, ingestion formats and language coverage in the vendor's documentation. That matters if application instrumentation depends on a specific client library rather than OpenTelemetry collectors or Prometheus-compatible metrics. For dashboards and alerting, the stated integration path is importing Grafana boards and configuring notification destinations. The product also lists LLM observability for tracing prompts, completions, token use and cost, but verify its instrumentation requirements and supported frameworks before wiring it into an application.
03OpenObserve pricing for developers
Self-Hosted Open Source is free forever under the AGPL-3.0 licence. Self-Hosted Enterprise is free up to 50 GB/day, then requires a sales quote; it adds SSO and RBAC, federated search, query management, workload management, audit trails and sensitive-data redaction. The Cloud Professional plan has a 14-day trial and unlimited users. Its listed $0.50/GB ingestion rate includes a 30% discount for an annual commitment; the pricing page lists no fixed monthly price.
Cloud costs also include $0.01/GB queried. Professional includes 15 months of metrics retention and 30 days of non-metrics retention; extra non-metrics retention costs $0.02/GB per additional 30 days. Cloud Enterprise pricing is custom, with volume discounts and BYOB for infinite retention. The bill therefore grows with ingested and queried data, and longer retention can add charges. Confirm expected query volume, retention needs and annual-commitment terms against your workload. Enterprise support beyond the listed plans is also quote-based.
04OpenObserve: open source, self-hosting and lock-in
OpenObserve's self-hosted open-source core is licensed under AGPL-3.0. The vendor also sells self-hosted Enterprise features; the free tier goes up to 50 GB/day, with pricing above that available from sales. Cloud Enterprise lists BYOB for infinite retention, while the homepage promotes “Your bucket, your collectors” as a way to avoid vendor lock-in.
The product uses Parquet storage, but the available information does not establish a specific export workflow, supported export formats or how portable saved queries and dashboards are. Ask the vendor how to retrieve raw telemetry, move it to another backend and export configuration before adopting it. SQL and Prometheus-compatible metrics may help keep parts of a stack familiar, but they do not by themselves guarantee a straightforward migration. Self-hosting gives teams control over deployment; it also means they own operations and upgrades.
05OpenObserve in production
The pricing details publish retention periods and a 50 GB/day free threshold for Self-Hosted Enterprise, but not general rate limits. The Cloud Professional plan lists unlimited users; ingestion limits, query concurrency, service-level commitments and other operational ceilings should be confirmed with the vendor. SSO and RBAC are listed for Cloud Enterprise and Self-Hosted Enterprise, not the free open-source plan. Premium support and SLAs are listed with Cloud Enterprise.
Reddit feedback is mixed. One self-hosting commenter reported querying several days of data in about two to four seconds on a four-core, 8 GB RAM VM, while another described a basic comparison where OpenObserve used more memory than several alternatives. That commenter also reported faster ingestion than Elasticsearch in their test. These are individual reports, not guarantees for a production workload. Test with representative data volume, query patterns and hardware, and check memory use, storage costs and recovery behavior before relying on it for incident response.
From the threadsWhat users say
Reddit sentiment is mixed: some self-hosters report useful query performance and an Elasticsearch replacement, while others raise concerns about memory, search costs and security features behind Enterprise. The discussion includes both favorable individual reports and skepticism about broad efficiency claims.
I can query multiple days of data in less than ~2-4 secs using a local debian VM with 4 cores/8GB of ram/HDD
openobserve eats more memory than other solutions
if you are using S3 as the backend storage then you would still need to read inside the files and therefore inducing a read/download cost
RBAC, SSO, fine-grained access — all locked behind “Enterprise.”
Questions people ask
Is OpenObserve free?
Yes. The Self-Hosted Open Source edition is listed as free forever and licensed under AGPL-3.0. Self-Hosted Enterprise is free up to 50 GB/day, but usage above that requires a sales quote. OpenObserve Cloud Professional offers a 14-day trial and charges based on ingestion, queries and retention.
How much does OpenObserve Cloud cost?
Cloud Professional lists $0.50 per GB ingested with an annual commitment; that rate includes a 30% discount. Queries cost $0.01 per GB, and extra non-metrics retention costs $0.02 per GB for each additional 30 days. The vendor publishes no fixed monthly price, so estimate costs from expected usage.
Can I self-host OpenObserve?
Yes. OpenObserve offers a free, AGPL-3.0 self-hosted open-source edition and a self-hosted Enterprise plan. Enterprise is free up to 50 GB/day and adds features including SSO, RBAC, federated search and audit trails. Contact sales for pricing above the daily threshold.
Does OpenObserve support Prometheus and OpenTelemetry?
The homepage describes Prometheus-compatible metrics, and a commenter on r/rust reports support for both OpenTelemetry and PromQL. OpenObserve also says existing Grafana boards can be brought over. Confirm current ingestion formats, instrumentation requirements and compatibility details in the vendor's documentation.
What should I check before using OpenObserve in production?
Confirm rate limits, query concurrency, ingestion ceilings and service-level terms with the vendor; these can affect incident response and cost. Check whether your deployment needs SSO and RBAC, which are listed for Enterprise plans, and verify export and migration workflows. Test with representative telemetry and query patterns before setting retention or capacity expectations.
Sources
- OpenObserve homepage
- OpenObserve pricing page
- Reddit: OpenObserve: Open source Elasticsearch alternative in Rust for logs. 140x lower storage cost
- Reddit: OpenObserve: Open source Elasticsearch/Datadog/Splunk alternative in Rust for logs, metrics, traces. 140x lower storage cost
- Reddit: So OpenObserve is ‘open-source’… until you actually try using it
- Reddit: OpenObserve? Is it good?