
We may earn a commission if you buy through links on this page. It never changes a score or a ranking. How we make money
The bottom line
Broad observability and automation, with costs and integration details to verify before production.
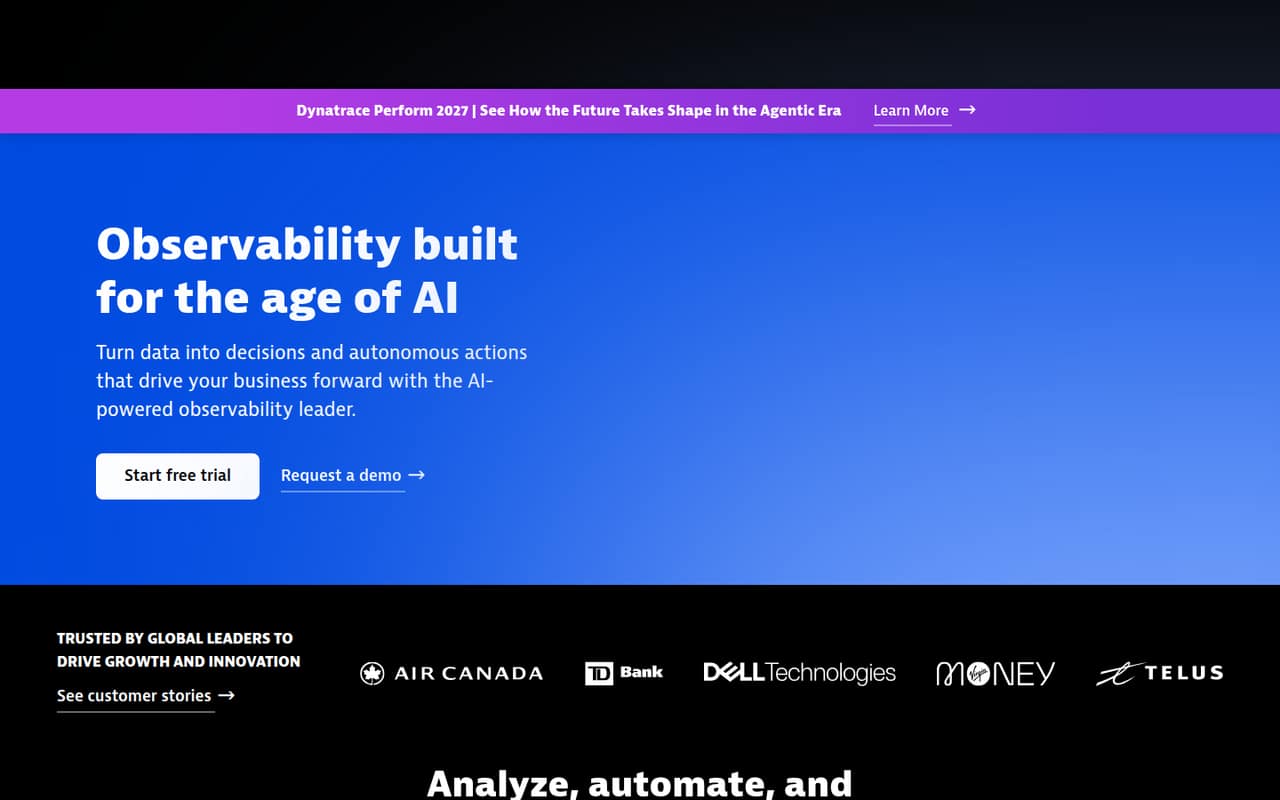
Dynatrace is an observability platform for applications, infrastructure, security, logs and digital experiences. It combines monitoring and analysis with features such as root-cause analysis, vulnerability detection and AI-assisted operations. Its coverage suits teams consolidating several observability needs in one platform.
The trade-offs are the minimum annual commitment and charges that grow with hosts, telemetry, retention and queries. Reddit users praise data collection and automation, while others report cost concerns and a mixed experience with the product. Validate the stack fit and model expected usage before committing.
Good fit if
- Teams consolidating observability tools
- Kubernetes and cloud-native operators
- Teams using tracing and user monitoring
Skip it if
- Small teams needing a free tier
- Metrics-and-logs-only workloads
- Teams requiring self-hosting
ScoresHow it rates
What works
- Covers application, infrastructure, security and user experience
- Includes distributed tracing and root-cause analysis
- Offers Kubernetes metrics, events and topology
- Includes AI Exploration at no additional charge
- Unlimited seats with no separate seat fees
What doesn't
- Requires a minimum annual platform commitment
- The minimum commitment amount is not published
- Costs vary with telemetry, retention and query volume
- SDK, language and API details need verification
- Open-source, self-hosting and export details are unclear
01What Dynatrace is, technically
Dynatrace is a commercial observability platform, rather than a standalone library or command-line tool. It sits alongside application and infrastructure workloads, bringing monitoring data into a platform for analysis across applications, infrastructure, security, logs and digital experience. Teams use it to detect problems, investigate causes and automate workflows.
Its feature set spans application performance monitoring, distributed tracing and profiling; infrastructure observability for multi-cloud environments; real-user and synthetic monitoring; session replay; log analytics; and application security. The platform also covers generative AI applications, large language models and agents. For Kubernetes, the plan details include metrics, events, health views and topology.
This breadth makes Dynatrace a candidate for teams replacing separate monitoring products or connecting operational signals to business data. It is less compelling if a team only needs basic metrics and logs. Before adopting it, map the data sources and workflows you need to the relevant product capabilities and usage charges.
02Dynatrace API, SDKs and docs
The homepage points developers to the Dynatrace Hub for integrations with cloud providers and other technologies. It also describes Grail as a data lakehouse and Dynatrace Intelligence as the platform’s analysis and automation layer. AI Exploration includes DQL queries and tool calls, plus Remote MCP Server access to non-LLM tools.
The homepage does not name an API protocol, SDK languages or a CLI. The vendor doesn't publish those integration details on the homepage, so confirm supported SDKs, languages, API methods and authentication in Dynatrace’s developer documentation before planning instrumentation. The listed product capabilities include application performance monitoring, distributed tracing and profiling, but they do not establish which code changes or agents a particular stack requires.
For a production integration, check how your framework and deployment model are supported, how telemetry is configured, and how the resulting data maps to Dynatrace’s pricing units. Also verify whether your existing pipelines and tools are available through the Hub.
03Dynatrace pricing for developers
Dynatrace has no free plan; the vendor offers a 15-day free trial. Foundation & Discovery starts at $7 per host per month, with billing listed at $0.01 per host-hour. Infrastructure Monitoring is $29 per host per month; Full-Stack Monitoring is $58 per 8 GiB host per month. These are listed monthly prices, not annual quotes.
Costs scale with telemetry and features. Logs and traces each ingest at $0.20 per GiB, retain at $0.0007 per GiB-day, and query at $0.0035 per GiB scanned. Real User Monitoring is $2.25 per 1,000 sessions; RUM with Session Replay is $4.50. There are no separate seat fees, and seats are unlimited.
Dynatrace requires a minimum annual platform commitment, but the amount is not published. Usage above that commitment is billed monthly at the same rates, without penalty-style overages. Budget by host memory, data volume, retention, scans and sessions—not just host count.
04Dynatrace: open source, self-hosting and lock-in
Dynatrace’s homepage and pricing information do not establish an open-source licence, self-hosted edition or data-export path. The vendor doesn't publish those terms in the reviewed product and pricing pages. Ask Dynatrace about licence terms, deployment options, export formats and any costs or limits attached to moving data out before making it a system of record.
The commercial model is an annual platform commitment with usage-priced capabilities. That creates a practical migration concern: teams should understand how they can retrieve telemetry and configuration, and whether dashboards, queries and alerting workflows can be recreated elsewhere. A Reddit commenter describes a self-managed observability stack as requiring substantial engineering effort, which is a reminder that the alternative also carries operational costs. Do not assume either portability or self-hosting; get the specifics in writing.
05Dynatrace in production
The pricing model makes telemetry volume, retention and query scans important production controls. Some data products include defined retention—for example, Traces includes 10 days, while Real User Monitoring includes 35 days—and extensions can add cost. The vendor's homepage does not publish request rate limits or uptime targets; confirm applicable service limits, reliability commitments, security controls and compliance terms with Dynatrace before depending on it.
Reddit feedback is mixed. One commenter calls OneAgent impressive but describes other parts of Dynatrace as painful; another says the platform excels at data collection and automation. A commenter also warns that AI-assisted root-cause analysis depends on good trace coverage, service boundaries, tagging and context. Treat those reports as user experiences, not guarantees. In a rollout, validate instrumentation coverage, alert quality, retention settings and the full annual commitment against realistic workload data.
From the threadsWhat users say
Reddit users praise Dynatrace’s collection and automation, but opinions on usability and cost vary. Several comments stress that value depends on workload size and using more than basic metrics and logs.
Dynatrace is probably the best “day-1 value” platform if your stack is supported
Dynatrace excels at its ease of data collection and the automation
They’re all ridiculously priced
OneAgent is really impressive but everything else in Dynatrace is a pain
Questions people ask
What does Dynatrace monitor?
Dynatrace covers applications, infrastructure, security, logs and digital experiences. Its features include application performance monitoring, distributed tracing, profiling, real-user and synthetic monitoring, session replay, vulnerability detection and Kubernetes monitoring. AI Observability is aimed at generative AI applications, large language models and agents.
Does Dynatrace have a free plan?
No. Dynatrace offers a 15-day free trial, but the listed pricing has no free plan. After the trial, the platform requires a minimum annual commitment. The vendor does not publish the minimum amount, so ask for a quote based on your expected workload and required capabilities.
How does Dynatrace price usage?
Pricing depends on the capability: examples include per-host, per-memory-GiB, per-session and per-pod charges, as well as rates for ingest, retention and queries. Dynatrace requires an annual platform commitment. Usage beyond it is billed monthly at the same rates, without penalty-style overages.
Can Dynatrace monitor Kubernetes?
Yes. Kubernetes Platform Monitoring includes Kubernetes metrics and events, health views and topology. The listed monthly price is $1.40 per pod, billed at $0.002 per pod-hour. It is included on hosts with Full-Stack Monitoring, which is priced per 8 GiB host.
Does Dynatrace include application security?
Yes. Its application security capabilities include Runtime Vulnerability Analytics for detecting and prioritizing vulnerabilities, and Runtime Application Protection for blocking exploitation attempts. Security Posture Management covers misconfiguration and runtime compliance monitoring, with listed coverage including CIS, NIST, DORA and HIPAA.
Sources
- Dynatrace homepage
- Dynatrace pricing page
- Reddit: Most affordable monitoring platform? Dynatrace is saying they want to charge $20,000 / yr MINIMUM to our client.
- Reddit: Datadog vs. Dynatrace vs. LGTM: Is the AI-driven MTTR reduction worth the 3x price jump?
- Reddit: Does Dynatrace worth its price?
- Reddit: What is the alternative to Dynatrace's Davis for the root cause analysis?