
We may earn a commission if you buy through links on this page. It never changes a score or a ranking. How we make money
The bottom line
A hosted observability and incident platform; check the integration surface and usage bill before committing.
Better Stack combines logs, traces, metrics, error tracking, uptime monitoring, status pages and incident response in a hosted platform. Its OpenTelemetry support and MCP server give teams ways to connect telemetry to existing workflows, while AI SRE features aim to help investigate incidents.
The free tier suits small projects, but production costs depend on telemetry volume, retention and add-ons. The vendor’s product details do not establish a public source licence, self-hosted edition or data-export path, so confirm portability and operational limits before making it a core dependency.
Good fit if
- Teams consolidating observability and incident response
- OpenTelemetry-based telemetry collection
- Projects needing uptime checks and status pages
Skip it if
- Teams requiring a verified self-hosted edition
- Buyers needing published API rate limits
- Organizations requiring a documented export path
ScoresHow it rates
What works
- Logs, traces, metrics and incidents share one platform
- OpenTelemetry and Prometheus support are listed
- Queries include SQL, PromQL and drag-and-drop
- Free plan includes monitors, heartbeats and telemetry
- MCP server connects telemetry to LLM workflows
What doesn't
- Public source licence and self-hosting details are unclear
- SDK and language support need confirmation
- Usage charges vary across listed pricing tiers
- Production rate limits are not published
- Reddit discussion offers little performance evidence
01What Better Stack is, technically
Better Stack is a hosted observability and SRE platform, not a client library or a command-line monitoring tool. It brings telemetry collection and querying together with incident management, external uptime checks, error tracking and status pages. The platform’s listed data types include logs, traces and metrics; its incident features include on-call scheduling and alerting.
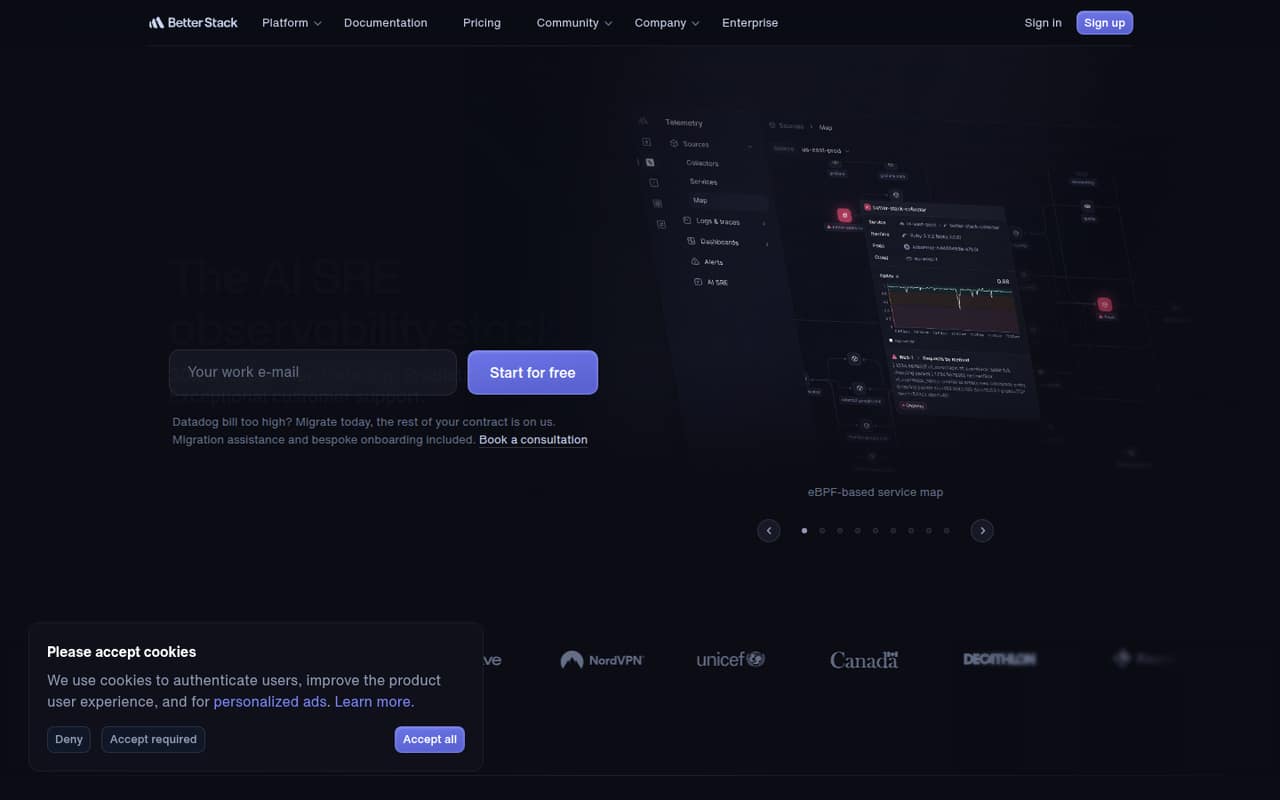
In a typical stack, Better Stack sits downstream of applications and infrastructure that emit telemetry, and alongside the team’s incident workflow. The homepage describes OpenTelemetry and Prometheus support, an eBPF-based service map, and a way to connect telemetry to existing LLM workflows through an MCP server. Teams can query data with SQL, PromQL or drag-and-drop tools, then use incident features in Slack or Microsoft Teams. The AI SRE is positioned as an investigation layer for telemetry and incident timelines, not as a replacement for human incident ownership. The platform also covers synthetic checks, including Playwright-based transaction monitoring.
02Better Stack API, SDKs and docs
The clearest developer integration surfaces in Better Stack’s product details are OpenTelemetry, Prometheus, an MCP server and Playwright-based transaction checks. The homepage says OpenTelemetry can gather traces, logs and metrics, and describes eBPF-based collection and remote monitoring of collector throughput, sampling, compression and batching. For analysis, it lists SQL, PromQL and drag-and-drop querying.
The homepage also names Slack and Microsoft Teams workflows, plus integrations with Linear and Jira for incident response and error tracking. Error tracking is described as compatible with Sentry SDKs. The vendor presents the MCP server as a way to integrate logs, metrics, traces and errors into existing LLM workflows. The product details do not establish specific programming languages, SDK packages, a CLI, or a REST API contract. Confirm SDK support, API authentication, webhooks, versioning and documentation for your language in Better Stack’s docs before building an integration. The distinction matters: a listed protocol or integration does not establish the client libraries or API guarantees your application needs.
03Better Stack pricing for developers
Better Stack has a free plan with 10 monitors, 10 heartbeats, one status page, 100,000 exceptions, 5,000 session replays, and 3 GB of logs and traces retained for three days. Responder costs $34 per license monthly or $29 per license per month billed annually. Telemetry bundles start with Nano (bundle tier 1) at $30 monthly or $25 per month billed annually; other bundle tiers list different prices for the same stated volume, so confirm which tier fits your account.
The listed telemetry add-ons charge for ingestion and retention by GB; query boost is $0.001 per GB scanned. Metrics, exceptions, session replays, monitors and heartbeats have separate included amounts and additional-use pricing. Other potential costs include AI SRE consumption, $9 per responder monthly for channel- and thread-based Slack or Teams workflows, and paid status-page options. Annual prices are discounted monthly equivalents. The vendor lists no fixed AI SRE price: it is consumption-based with model-specific in-app pricing.
04Better Stack: open source, self-hosting and lock-in
Better Stack is presented as a hosted platform. The vendor lists custom cluster deployment as an Enterprise option, but that does not establish that customers can run the software themselves. The vendor does not publish a public open-source licence or a self-hosted edition in its product and pricing details; ask directly if either is a requirement.
The vendor’s product details also do not describe a data-export path. Before moving production telemetry into the platform, confirm how to retrieve logs, traces, metrics, incident records and status-page data, and whether export has limits or extra costs. Lock-in risk depends on how much of your workflow uses Better Stack-specific dashboards, alerting, incident procedures and AI investigations. OpenTelemetry and Prometheus support can help keep telemetry collection aligned with common formats, but do not guarantee that queries, alert rules or incident history will transfer unchanged. Test an exit plan with representative data and workflows before depending on it.
05Better Stack in production
The production case is broad coverage in one platform: telemetry, alerts, incident coordination, uptime checks and status pages. Better Stack lists OpenTelemetry collection, Prometheus support, phone-call and SMS alerts, and Playwright-based transaction checks. Its homepage also describes adjusting collector sampling, compression and batching. These features make it worth evaluating for teams that want fewer separate monitoring and incident tools.
Before rollout, ask the vendor for the ingestion and query limits, API rate limits, retention behavior, uptime SLA, security controls, compliance documentation and data-location options that apply to your plan. The pricing page lists included volumes and usage charges, but your bill can grow across multiple data types and add-ons. Check failure behavior for alert delivery and integrations, and confirm how to export telemetry and incident history. Reddit threads raise questions about synthetic monitoring with Playwright and switching from Better Stack, but do not provide substantial user reports on reliability or production performance.
From the threadsWhat users say
The Reddit material is mostly buyer questions rather than product reviews. Users raise alternatives and Playwright-based synthetic monitoring, but the threads provide little evidence about reliability, support or production performance.
I'm considering switching from Better Stack to one of these alternatives for my business
I am specifically interested in synthetic monitoring with playwright
Pricing is not the problem
I'd love to hear your opinions and recommendations to make an informed decision
Questions people ask
What does Better Stack do?
Better Stack combines observability, incident management and external monitoring in a hosted platform. Its listed tools cover logs, traces, metrics, error tracking, uptime checks, status pages, on-call scheduling and an AI SRE for incident investigation.
Does Better Stack support OpenTelemetry?
Yes. Better Stack lists OpenTelemetry support for collecting telemetry, and its homepage describes gathering traces, logs and metrics. It also describes eBPF-based collection and remote monitoring of collector throughput, sampling, compression and batching.
Can Better Stack run Playwright checks?
The homepage lists Playwright-based transaction checks that run with a real Chrome browser instance and a JavaScript runtime. The pricing page lists transaction monitoring at $1 per 100 Playwright minutes, so include that usage in your cost estimate.
Does Better Stack have a free plan?
Yes. The Free plan lists 10 monitors, 10 heartbeats, one status page, 100,000 exceptions per month, 5,000 session replays, and 3 GB of logs and traces retained for three days. Check the current pricing page before production use.
Can I self-host Better Stack?
The vendor lists custom cluster deployment as an Enterprise option, but that does not confirm a self-hosted software edition. Better Stack’s product and pricing details do not publish a public open-source licence or self-hosting instructions. Ask the vendor about deployment and data-export requirements.